Public Library Dashboards & Visualization Tools in Wisconsin
Dashboards turn complex datasets into visual summaries helping you spot trends, compare libraries, and make data-driven decisions. Many Wisconsin dashboards use data from the Wisconsin Public Library Annual Report see Local Sources) and some offer pre-built data visualizations so you can explore data without needing advanced analysis skills. You were trained to be a librarian, not a data analyst, after all!
A data dashboard is a visual display of information that summarizes key metrics, highlights patterns, and helps you interpret large datasets quickly. Well designed dashboards are useful for quickly communicating about data in a user-friendly and intuitive way.
- Static dashboards: Charts and graphs are pre-rendered and easy to read.
- Interactive dashboards: Include filters, dropdowns, or selection tools so you can explore the data further.
The WPLC Data Dashboard includes select items from the Wisconsin Public Library Annual Report in a visualized format that allows for both individual library data to be displayed, as well as peer comparisons and strategies for benchmarking library data.
In 2024, the WPLC ran a pilot of this LookerStudio data dashboard to help gain understanding on the benefits for libraries having access to a visualization tool of annual library survey data. To date, the WPLC is making this dashboard available to public librarians statewide for free.
Tip: Training Matters
Before diving into the WPLC Data Dashboard, make sure you start by reviewing the training kit WPLC Dashboard Pilot: Training Materials developed by a Data Analyst at WiLS.
South Central Library System (SCLS) “Fast Facts Dashboard”
The Fast Facts dashboard provides a snapshot of library service data across multiple dimensions including: circulation, program attendance, collection size, and technology usage. Data for the dashboard comes from the Wisconsin Public Library Annual Report and Wisconsin’s Digital Library Annual Statistics. The dashboard is designed as an at-a-glance summary of library activity for a given year, and the selected view can be downloaded as an image file or PDF for inclusion in reports or on a website.
IFLS Data Dashboard – The IFLS data dashboard is a real-time updating source of statistics on usage at IFLS member libraries. Includes ILS, E-materials, technology use, and website use data. Information can be filtered by specified time periods and some options for visualizations are available. Data can also be downloaded in Excel format.
Northern Waters Library Service (NWLS) Data Dashboard – The NWLS data dashboard is a real-time updating source of statistics on usage at NWLS member libraries. Includes ILS, E-materials, technology use, and website use data. Information can be filtered by specified time periods and some options for visualizations are available. Data can also be downloaded in Excel format.
Wisconsin Valley Library Service (WVLS) Data Dashboard – The WVLS data dashboard is a real-time updating source of statistics on usage at WVLS member libraries. Includes ILS, E-materials, technology use, and website use data. Information can be filtered by specified time periods and some options for visualizations are available. Data can also be downloaded in Excel format.
South Central Library System (SCLS) Tableau Public Profile – The SCLS Tableau Public profile page collects data dashboards and infographics published by SCLS. The dashboards are roughly organized by subject, and include examples of visualizations based on various data sources (ILS, database usage, DPI Annual Reports, community surveys, US Census, etc.).
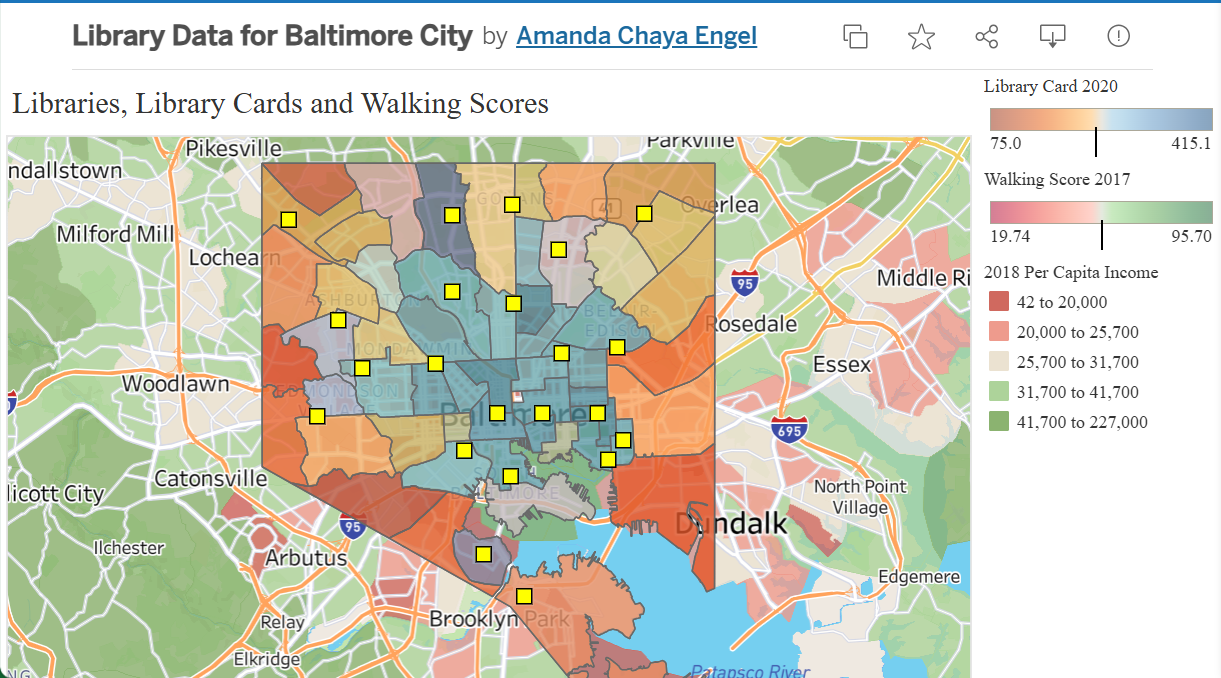
Baltimore City Library Data
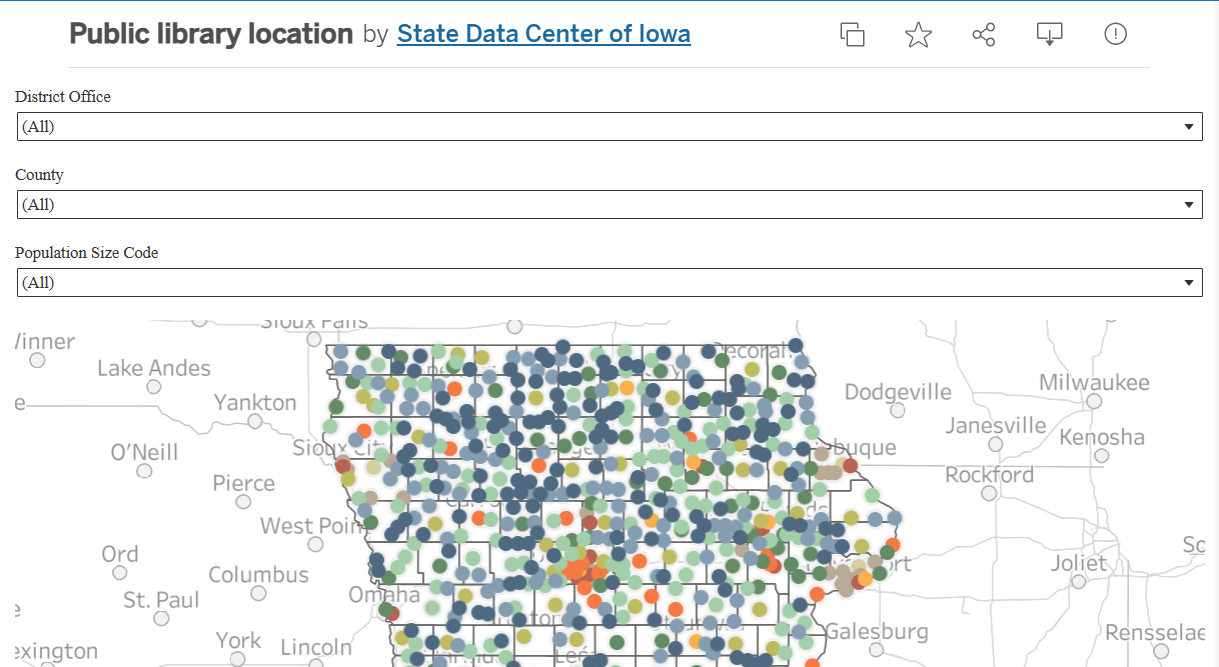
Iowa Public Library Data
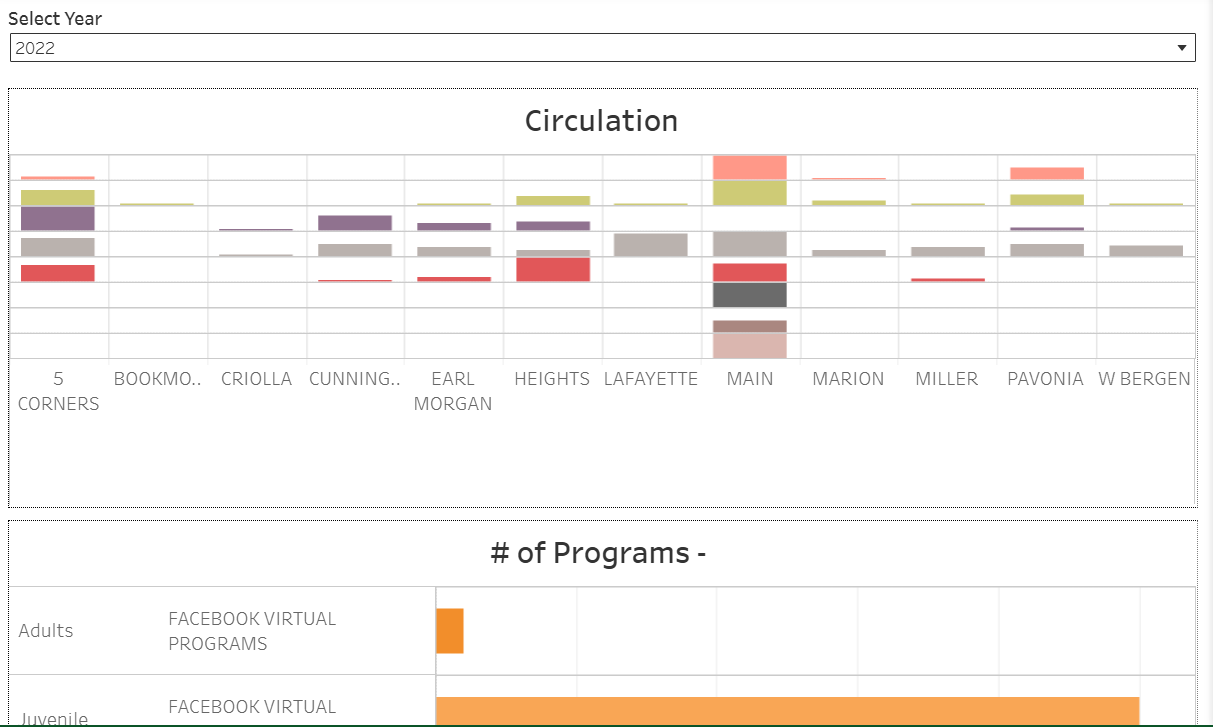
Jersey City Public Library
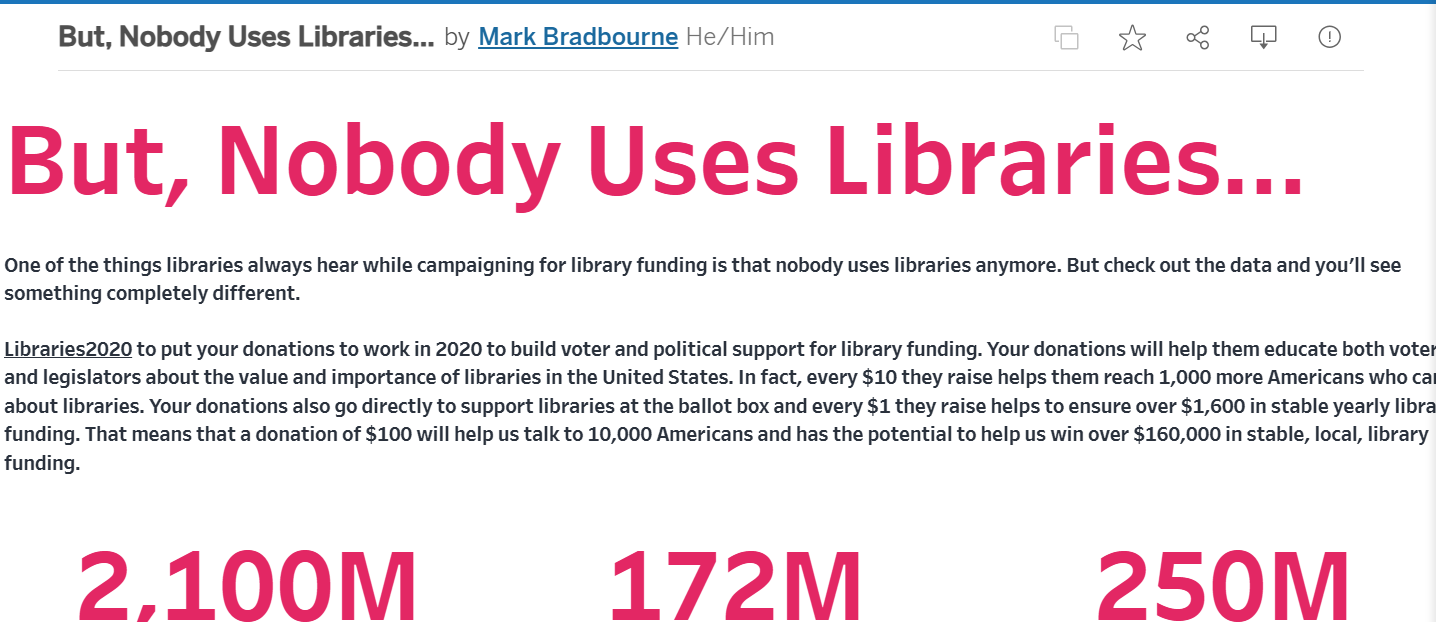
Libraries2020
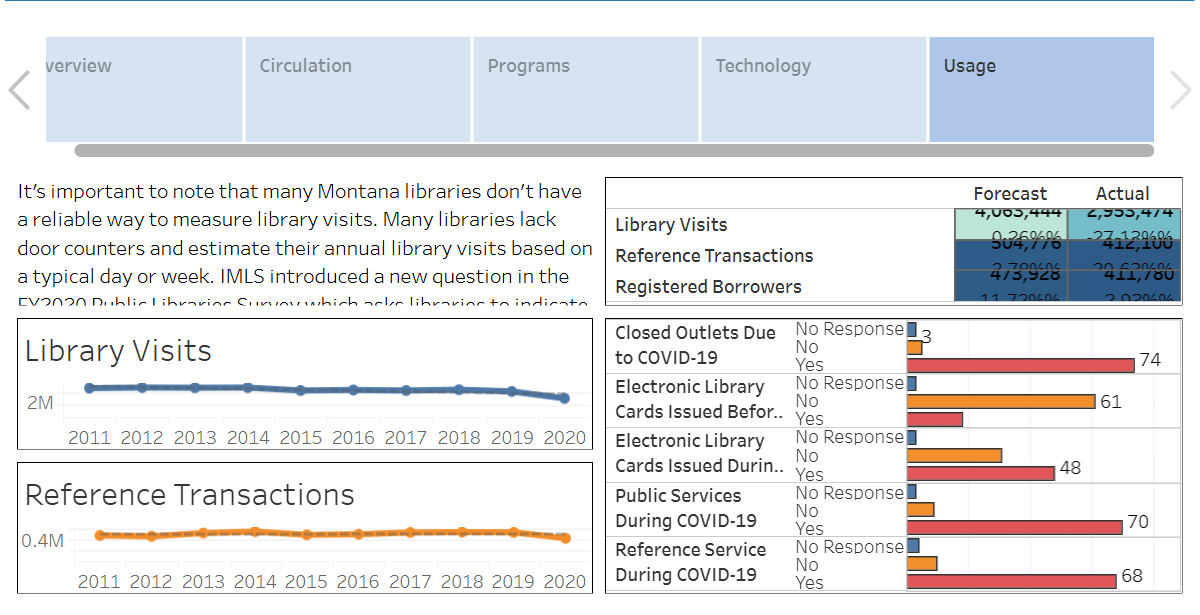
Montana Public Libraries – Covid 19 Impacts
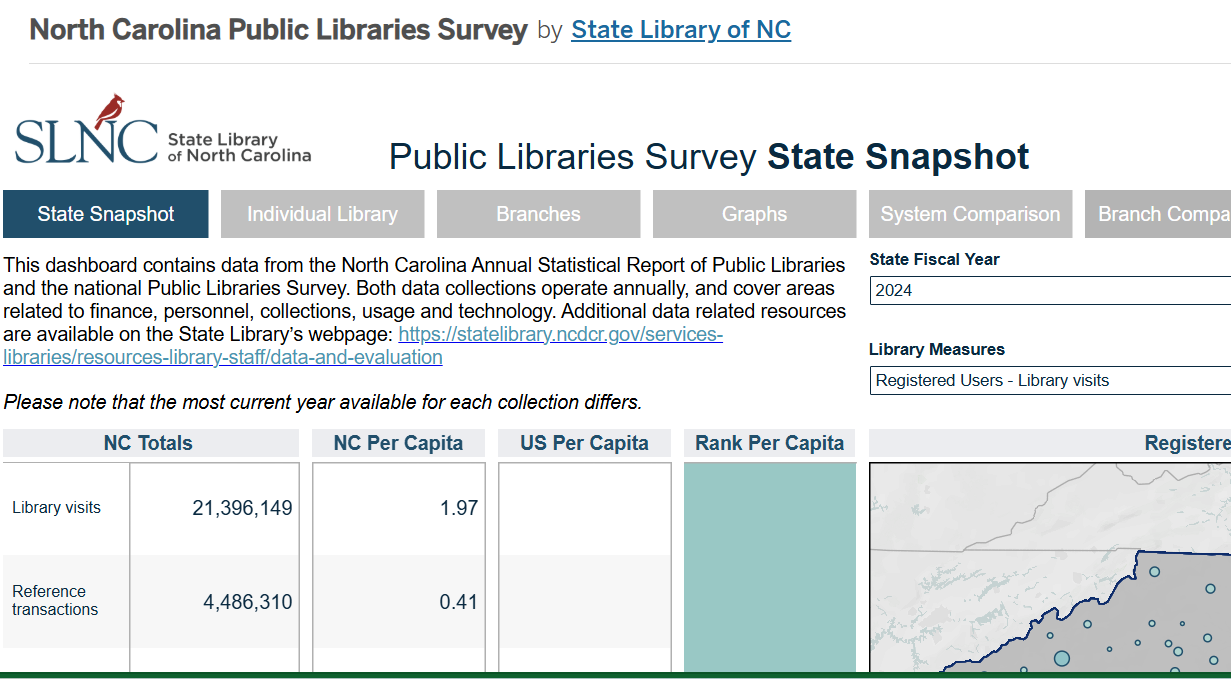
North Carolina Public Libraries
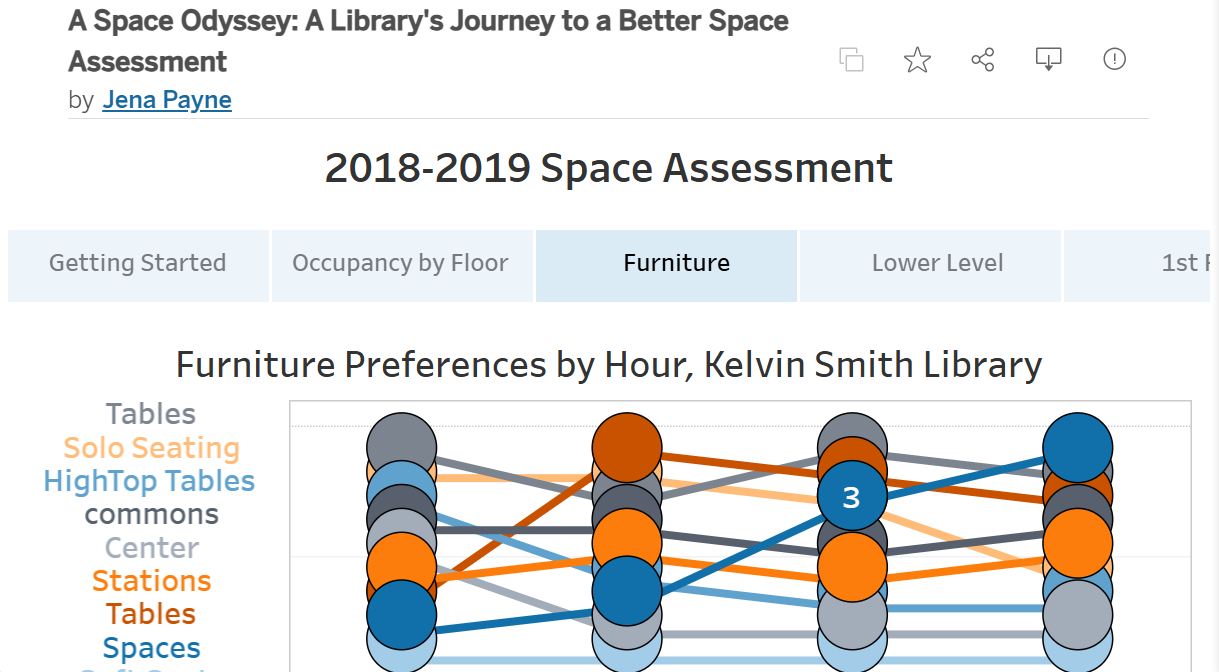
Library Space Assessment
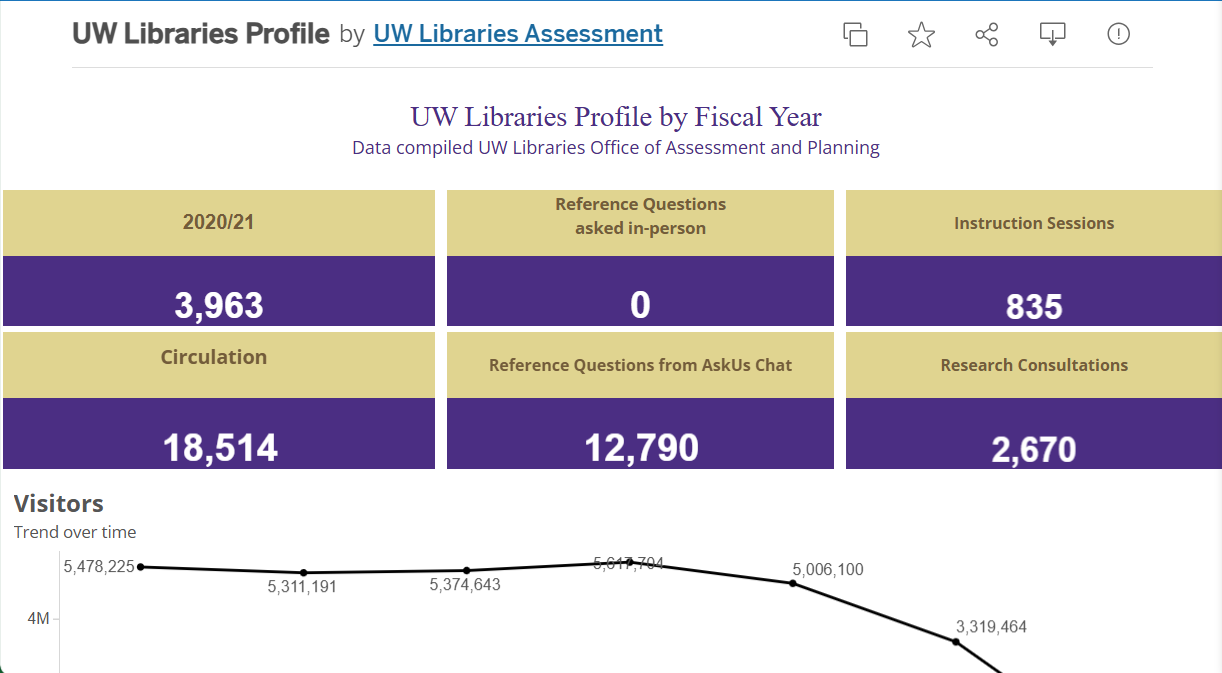
University of Washington Library
- Focus on what matters: Start with your library’s own data before exploring peer comparisons.
- Use filters wisely: Narrow by date range, program type, or user group to make insights more meaningful.
- Export visuals: Charts and graphs can be copied into presentations, reports, or advocacy materials.
- Keep it simple: Don’t overwhelm your audience. Highlight 1–2 key metrics per chart.
- Collaborate: Ask a colleague to review your dashboard insights. They may spot trends or questions you missed.